Wednesday, August 31, 2016

Feature Engineering - Get Lag Features, Rolling means in SQL and R

When preparing the training dataset for time series data, it is very often that we need to create new features. In this post, I talk about how to generate lag features, rolling means (standard deviations) within a preceding time window, and rolling aggregations within a following time window.

I have prepared a sample dataset, which can be downloaded at this link .

Sample input data:

Expected output data:


SQL code by running on Azure SQL server:


with t1 as (select  PID as ItemID, cast (VisitYear as int) as Year,  cast (VisitMonth as int) as Month, cast (Cost as float) as Value from PatientCostSample),
 t2 as(
select ItemID, Year, Month, Value,
avg(Value) over(partition by ItemID order by ItemID, Year, Month rows 4 preceding) as RollingMeanPre5M,
 LAG(Value, 1) OVER (partition by ItemID order by ItemID,Year, Month) AS Value_m1M,
 LAG(Value, 2) OVER (partition by ItemID order by ItemID,Year, Month) AS Value_m2M,
 LAG(Value, 3) OVER (partition by ItemID order by ItemID,Year, Month) AS Value_m3M,
max(Value) over(partition by ItemID order by ItemID, Year, Month ROWS 3 preceding) as MaxValuePre4M,
sum(Value) over(partition by ItemID order by ItemID, Year, Month ROWS BETWEEN 1 FOLLOWING AND 3 FOLLOWING) as Next3MAggValue    
       from t1 )

select *  from t2 order by ItemID, Year, Month;


R code by using dplyr and zoo packages (output as shown below)


Below is the R scripts to generate this result. I am attaching its image due to formatting issue with the Blog post.


Another Blog post is also worth reading.

Sunday, February 28, 2016

Data Analysis for Topics on Twitter - #Justice4Liang #rally220

Feb 20, 2016, which was a historic moment for many people who care about the fair justice for previous NYPD officer Peter Liang. People across more than 10 major US cities rallied peacefully and got their voice heard. In this post, we want to show how the #Justice4Liang topic discussed in Twitter, which is now a self-media platform to make everyone a media reporter.

This fun work consists of three major steps:
(1) Data acquisition: to obtain tweets about  #Justice4Liang  #rally220 from Twitter;
(2) Data preparation: to parse the data into correct format;
(3) Data exploratory study.

There is potential to generate more insightful data analytics. Today, we just show some exploratory analysis results.

 Following figure shows a snapshot of the data we have collected.


The data contains the tweets about  #Justice4Liang  #rally220 from "02/22/2016 00:46:34" "02/26/2016 07:21:16" UTC time. The following figure shows the tweets trending. We can see the trend is going down. We can also monitor if the trend will go up if any organization is going to push it.


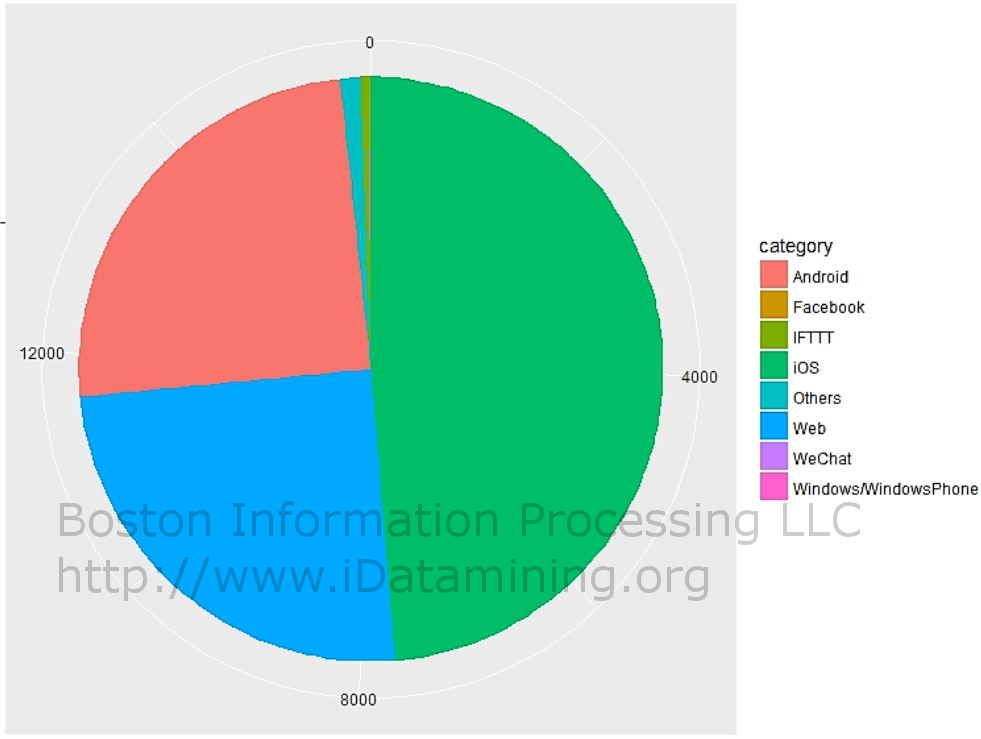
What device/application people use to publish tweets? Following figure answers this question. Using Facebook is really very small part.


We also produce a word cloud for the tweets locations. 9612 tweets, which accounts for 60.8% of the data,  have a non-null location.