I have prepared a sample dataset, which can be downloaded at this link .
Sample input data:
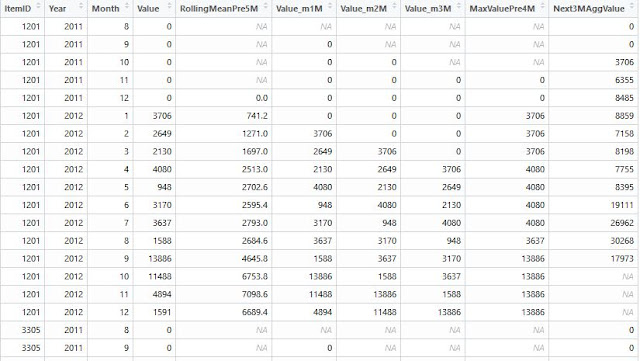
Expected output data:
SQL code by running on Azure SQL server:
with t1 as (select PID as ItemID, cast (VisitYear as int) as Year, cast (VisitMonth as int) as Month, cast (Cost as float) as Value from PatientCostSample),
t2 as(
select ItemID, Year, Month, Value,
avg(Value) over(partition by ItemID order by ItemID, Year, Month rows 4 preceding) as RollingMeanPre5M,
LAG(Value, 1) OVER (partition by ItemID order by ItemID,Year, Month) AS Value_m1M,
LAG(Value, 2) OVER (partition by ItemID order by ItemID,Year, Month) AS Value_m2M,
LAG(Value, 3) OVER (partition by ItemID order by ItemID,Year, Month) AS Value_m3M,
max(Value) over(partition by ItemID order by ItemID, Year, Month ROWS 3 preceding) as MaxValuePre4M,
sum(Value) over(partition by ItemID order by ItemID, Year, Month ROWS BETWEEN 1 FOLLOWING AND 3 FOLLOWING) as Next3MAggValue
from t1 )
select * from t2 order by ItemID, Year, Month;
R code by using dplyr and zoo packages (output as shown below)
Below is the R scripts to generate this result. I am attaching its image due to formatting issue with the Blog post.
Another Blog post is also worth reading.


